
Intro:
One of the most helpful tools in SMS Advanced is the ability to pull data from many layers into one layer. Examples might be to pull the underlying soil test values into a yield zone map or to examine the yield by planting prescription. While there are methods for querying this same information using the select/query tools or by producing a comparison report, this method creates a permanent map layer that combines the attributes of multiple layers.
The concept is that we must have a ZONE layer and a Points layer. SMS will then average the points’ values into the zones to create a new combined layer.
Instructions:
- Bring your intended points layer into the main map window.

2. Bring your intended polygon/region layer into the same map window.

3. The two layers in play will be displayed either on top of legend window or one above and one below.

4. From the New Layer Window or File>New> choose New generic Layer. The tools needed are only found in this type of layer and is limited to SMS Advanced level of program.

5. Whenever we create a new generic layer we must remember that you can SEE the other layers in behind but the layer itself at this point is EMPTY. So the first thing we must do is COPY FROM LAYER from the Special tools menu on the right panel.

6. From the layers we had present when we started the new generic layer, select the one we need. In this case it is the polygon layer. You will have visual confirmation that you are looking at the right layer.

7. The next window shows you a preview of your selection with all of the polygons selected or highlighted.NEXT>

8. Make sure you select Copy Spatial and Attribute Data. The attribute data in this case is the information from the polygons that you want in the resultant layer, i.e. yield. FINISH>

9. The map is now a copy of the polygon map, the other two original maps are still in behind. To see what you have made go to the DATA GRID. And each polygon now has its attribute information.
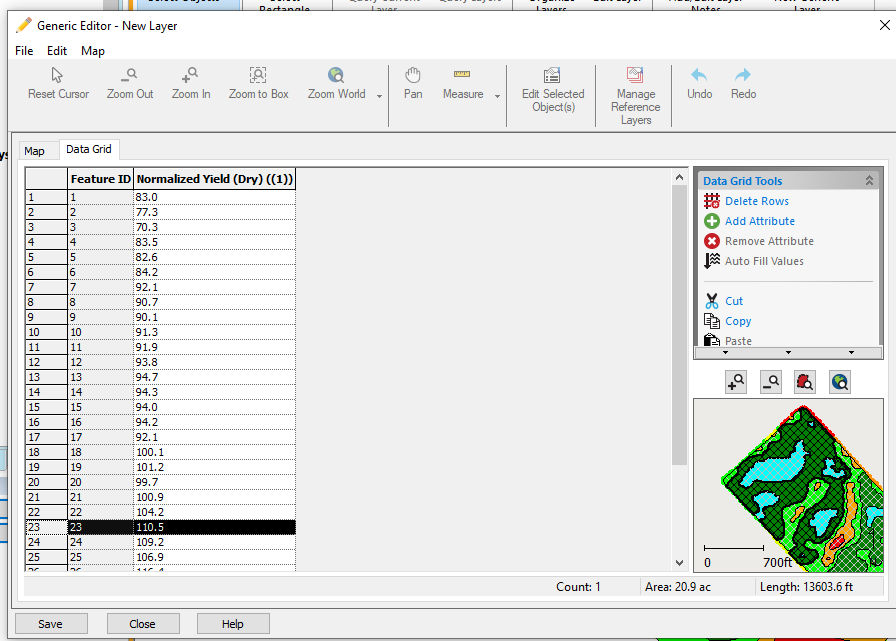
10. Now comes the exciting part: Select the Map tab again so you can see the special tools menu. This time choose Average Data by Polygon.

11. You will be presented with a menu to select the attributes from the POINT layer (Your soil test results in this example). The Layer is Soil Test and the Attributes are selected from the drop down and then ADD to the Selected Attributes/right hand panel. Normally we do not use the REMAP Attribute or the list of attributes in the bottom left corner. That is for another option not discussed here.

12. Double check that your attribute and RE-mapped attribute are the same. OK> to continue

13. Checkout the results in the DATA GRID. You should now see a soil test value for each of the attributes in each of the polygons.

14. If you have some very small polygon regions you might notice that they have zeros in the soil test values. This indicates that no points existed in the same spatial footprint as that polygon and so the result = 0. The only fix for this is to choose a better source polygon layer, or merge these polygons into their surrounding neighbours before performing the “Average Data by Polygons” command. This can be done in the generic editor.

15. Finally, save this layer to either a generic layer type or to an analysis layer type in your management tree.

16. An extra tip is to use the Dataset Info tab to name this layer in a meaningful way such as Soil Test by Multiyear Yield zones so that you can understand what this analysis layer means. Use the Description box for further information for long term storage.

Karon Tracey Cowan, AgTech GIS
March 2020
