Author: Karon Tracey-Cowan
Owner of AgTech GIS since 1995. Provider of AgLeader SMS Software and training in Canada, mapping services and learning experiences in the Precision Ag space.

AgLeader SMS now includes Sentinel 2 Imagery Analysis Downloads
SMS Map Skills: Creating Prescription Map by Equation Plus Test Strips
SMS Map Skills: Making Special Purpose Generic Layers
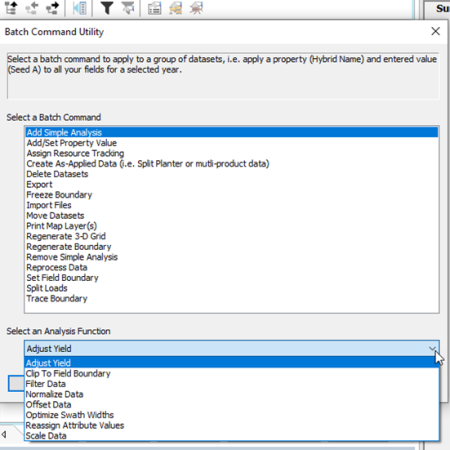
SMS Map Skills: Creating a Batch Export
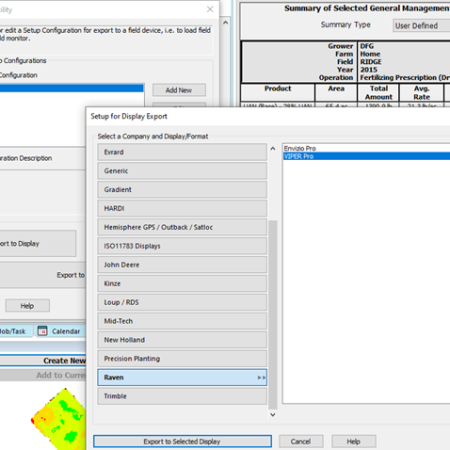
SMS Map Skills: Exporting Rx Maps to Raven
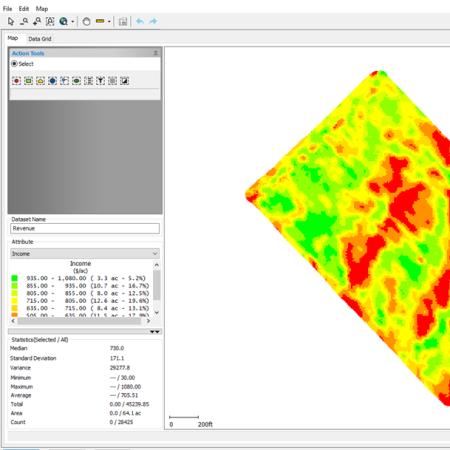
SMS Map Skills: Creating a Revenue Map Using Analysis Wizard (Advanced)
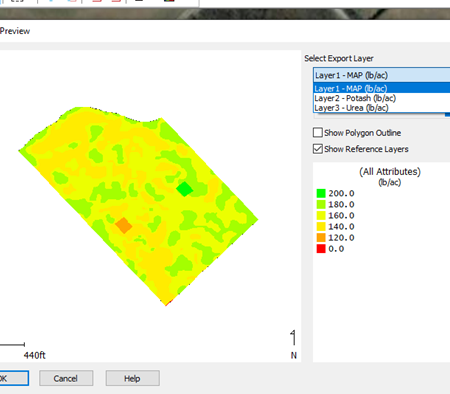
SMS Map Skills: Exporting Rx Maps to Multilayer Shapefiles
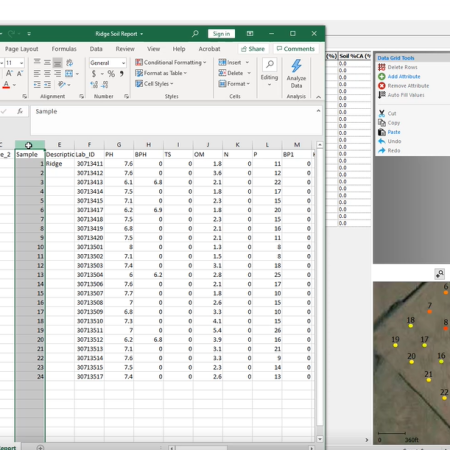
SMS Map Skills: Video Merging Lab Files